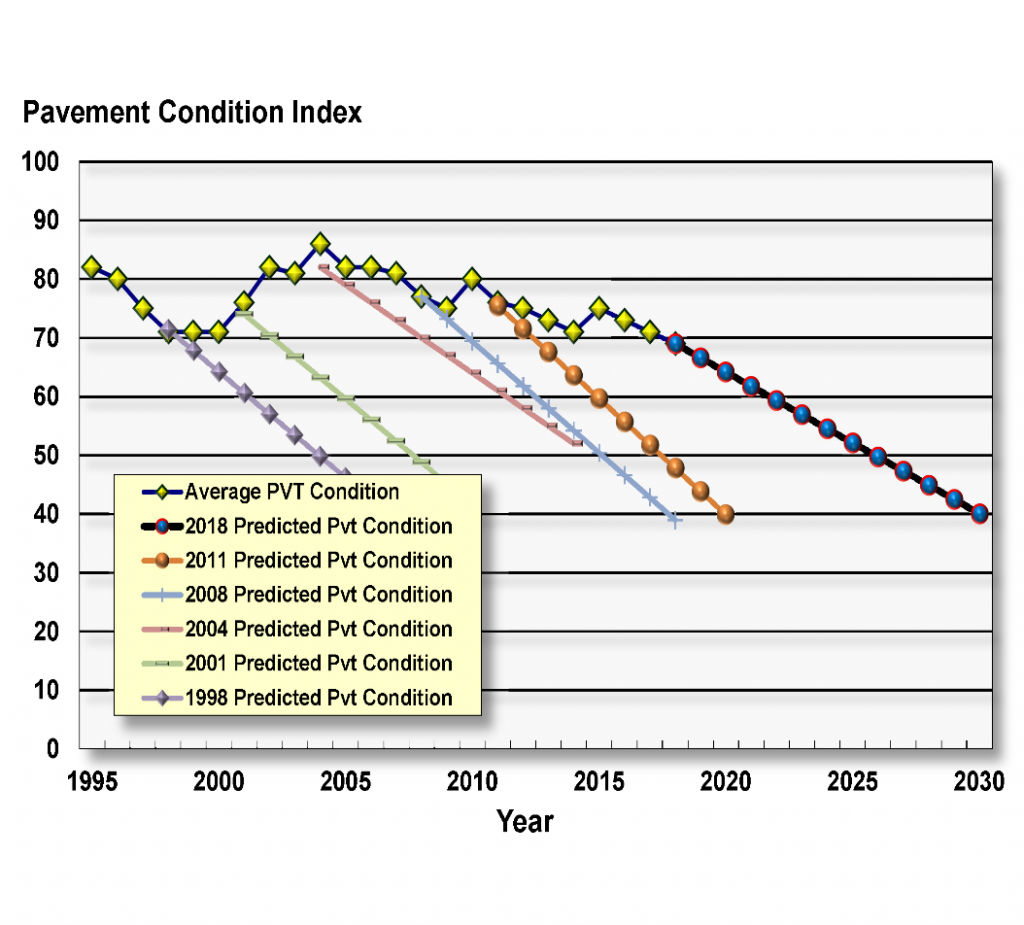
By knowing the construction date or date of last overlay, we can make a prediction of future pavement conditions. This can be done for individual management units, a property, or for a portfolio. The Figure illustrates six pavement inspection points with predicted conditions at each point. The yellow diamonds present the actual pavement condition history.
The slope of the predicted pavement condition line is of interest. Poor performance is indicated by a steep slope and indicates higher costs are on the way. For example, the 2008 prediction is steeper than the 2018 predicted slope. 2018 predicted performance shows much better performance with lower future costs. A typical pavement deterioration rate is 2.0 to 3.0-PCI points per year. Combining this Figure with others, such as the FREQ, give an overall view of pavement history, current conditions, and predicted conditions.
Figure from Zimmer Consultants.